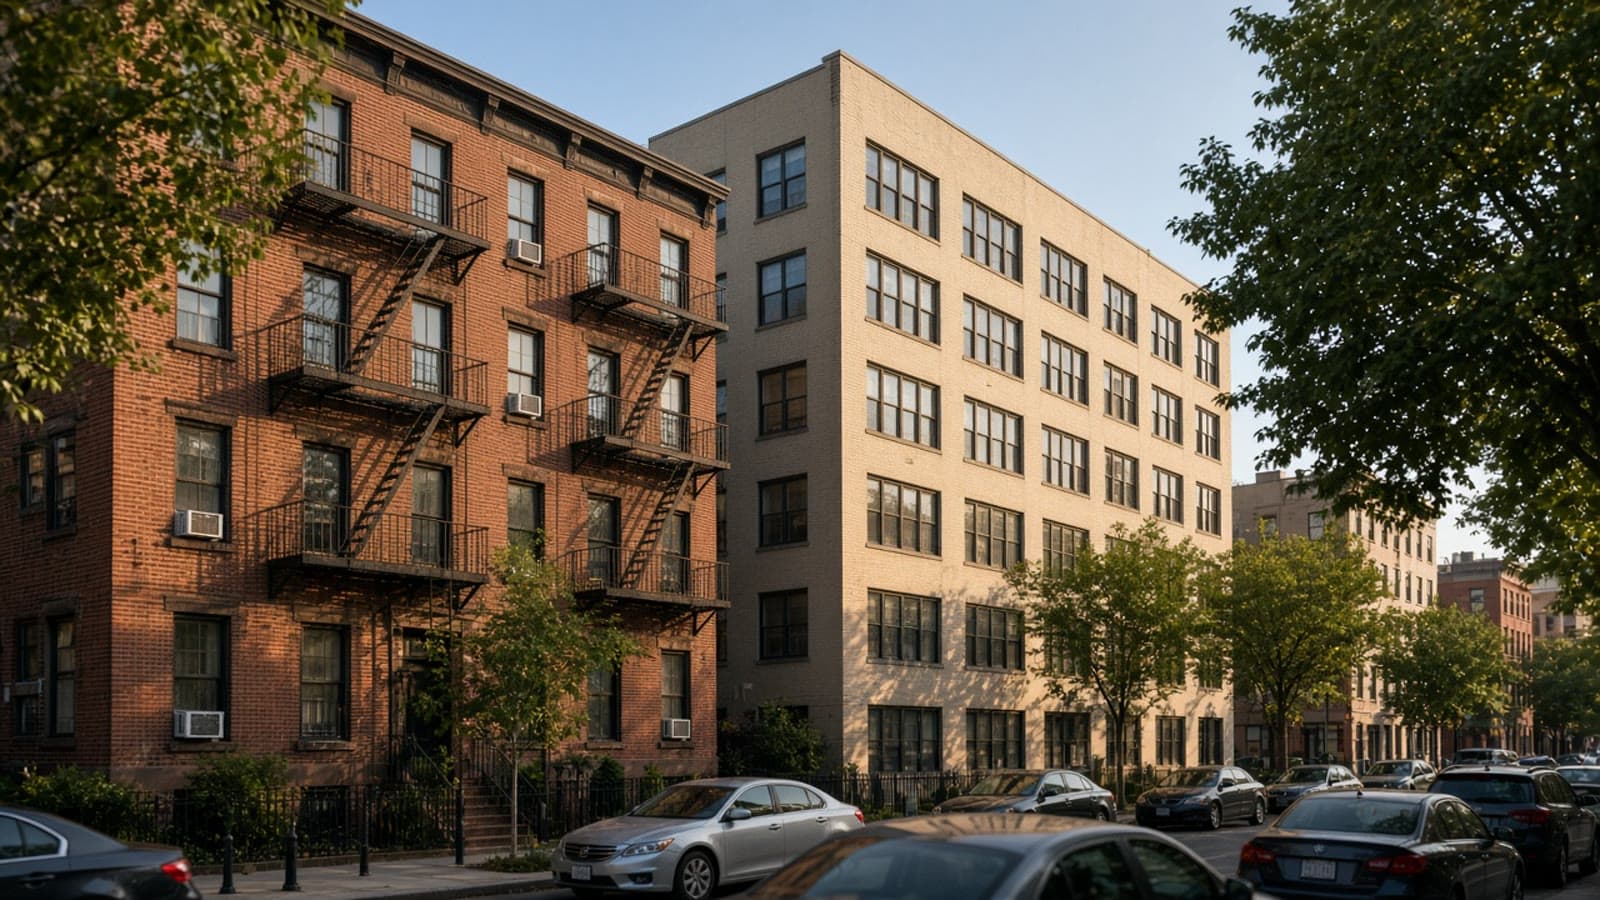
Soft-quote and term-sheet pricing on Northeast multifamily bridge loans from April through August 2026.
On this page
Based on soft-quote and term-sheet loan quotes on multifamily properties in the Northeast, priced as bridge financing (light and heavy bridge combined), from April through August 2026.
Fixed-rate quotes in this pool run from 6.65% to 11.25%, with a median of 9.50% — a wide range typical of bridge financing, where the loan spans everything from light transitional deals to heavier repositioning plays. Floating-rate quotes, presented separately, range from 6.41% to 11.25%, with a median of 9.00%. LTV has a median of 67.5% (60%–80%). LTC — recorded on a smaller subset — has a median of 75% (70%–85%). DSCR is recorded on only a handful of quotes in this pool (1.25x–1.50x, too thin to treat as a stable benchmark). Of the quotes where recourse type was specified, the large majority carry full recourse, with a small share carrying partial or burn-off structures; separately, the large majority carry personal recourse guarantees, with a modest non-recourse share as well.
Terms in this pool are short, as expected for bridge financing — most run 12 months, with a smaller share extending to 24 months and a long tail of other terms. An interest-only period is present on nearly every quote in this pool, ranging from 6 to 24 months; a stated amortization schedule appears on only a couple of quotes and isn't meaningful to report as a pattern here. Loan sizes in this pool range from $1,290,000 to $7,600,000, with a median loan amount of $2,872,000.
| Metric | Range | Median |
|---|---|---|
| Fixed rate | 6.65% – 11.25% | 9.50% |
| Floating rate | 6.41% – 11.25% | 9.00% |
| LTV | 60% – 80% | 67.5% |
| LTC | 70% – 85% | 75% |
| DSCR | 1.25x – 1.50x (thin sample) | 1.25x |
| Recourse (of specified) | Mostly full, some partial/burn-off | — |
Fixed rate by asset type
| Asset type | Range | Median |
|---|---|---|
| Urban Walk-up | 6.65% – 11.00% | 8.00% |
| Mid/Highrise | 9.50% – 11.25% | 10.23% |
Floating rate by asset type
| Asset type | Range | Median |
|---|---|---|
| Urban Walk-up | 6.41% – 9.15% | 8.65% |
| Mid/Highrise | 9.25% – 11.25% | 10.62% |
Mid/Highrise prices notably wider than Urban Walk-up across both rate types — roughly 200–225 bps at the median. That likely reflects the larger, more complex repositioning projects that tend to come with mid/highrise bridge deals versus smaller walk-up transitional financing.
Fixed rate by loan size
| Loan Size | Range | Median |
|---|---|---|
| Under $3M | 7.50% – 11.00% | 9.73% |
| $3M – $7M | 6.65% – 6.96% | 6.65% |
Larger deals in this pool priced dramatically tighter — the $3M–$7M band clusters near 6.65%, versus a median above 9.5% under $3M. That's a much wider gap than Lev typically sees on permanent financing, consistent with smaller bridge loans skewing toward higher-margin private and debt-fund lenders rather than the more institutional capital competing for larger deals.
FAQ
What fixed rates is Lev seeing on Northeast multifamily bridge loans right now?
Lev is seeing a median of 9.50%, with a wide range from 6.65% to 11.25% depending on asset type, loan size, and deal complexity.
What about floating-rate quotes?
Lev is seeing floating-rate quotes range from 6.41% to 11.25%, with a median of 9.00% — similar in shape to fixed, with the same Mid/Highrise premium.
Does the multifamily subtype affect pricing?
Yes, significantly. Urban Walk-up bridge loans price meaningfully tighter than Mid/Highrise in this pool — roughly 200+ bps apart at the median on both fixed and floating.
Does loan size affect pricing on Northeast multifamily bridge deals?
Yes, and by a wide margin — larger deals ($3M+) in this pool priced dramatically tighter than smaller ones, likely reflecting which lender types compete at each size.
What LTV and LTC is Lev seeing required?
Lev is seeing a median LTV of 67.5% and a median LTC of 75% across this pool.
Another perspective.
All articles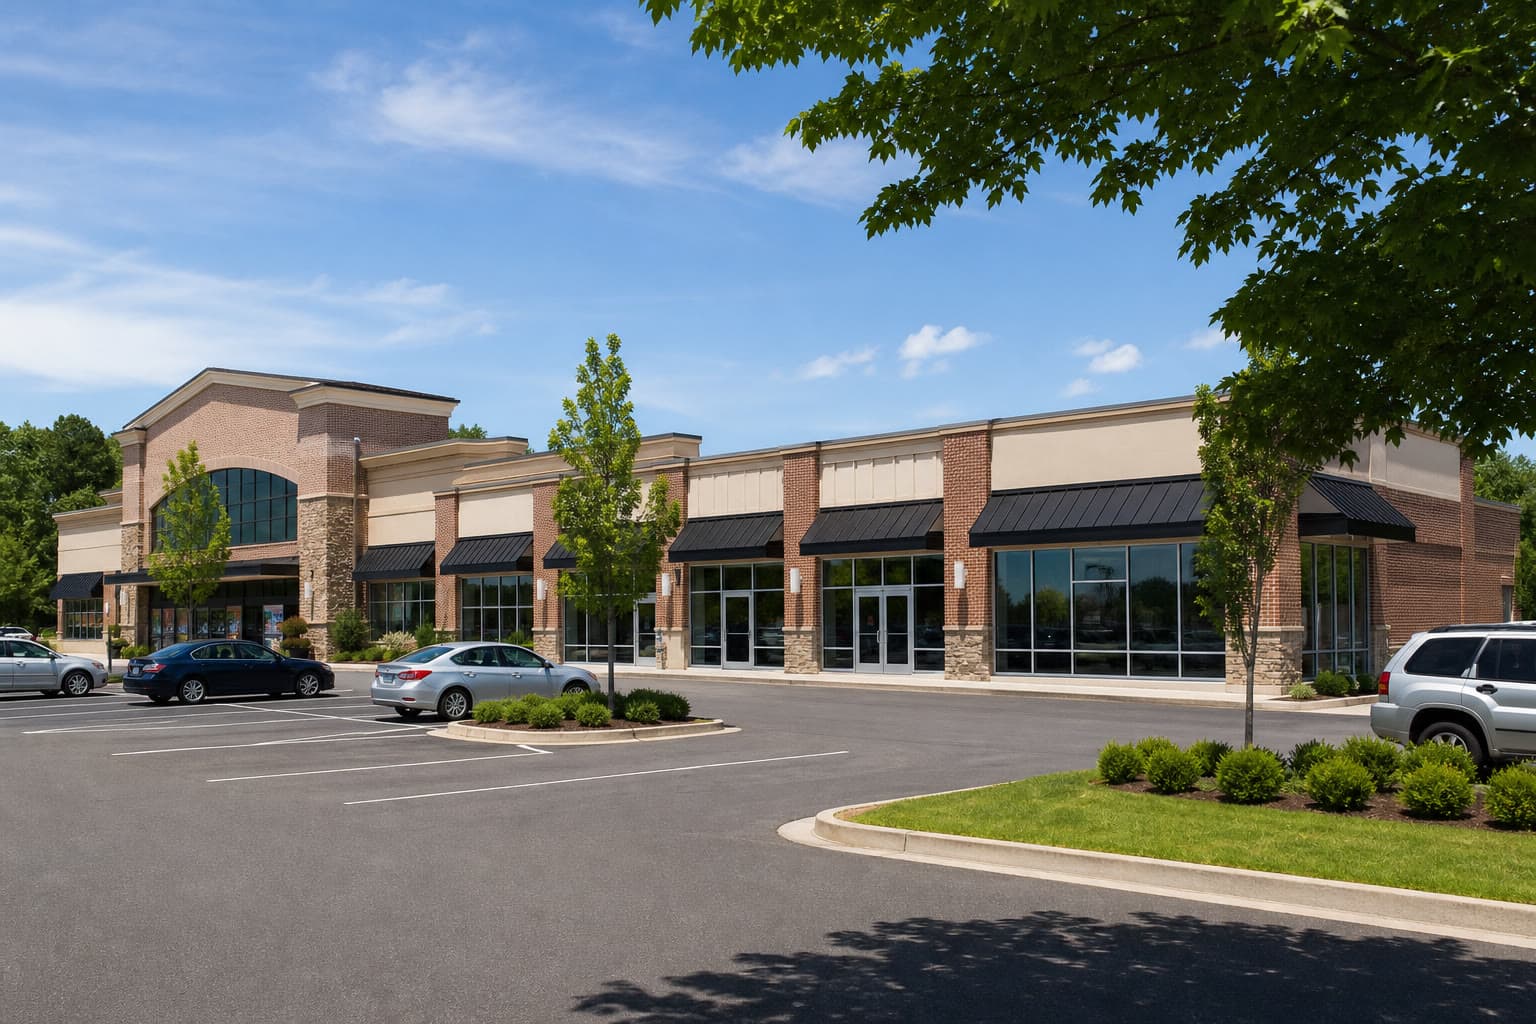
Retail Permanent Loans in the Midwest and Northeast: Fixed Rates Near 6.75%
Soft-quote and term-sheet pricing on retail permanent loans in the Midwest and Northeast from May through August 2026.
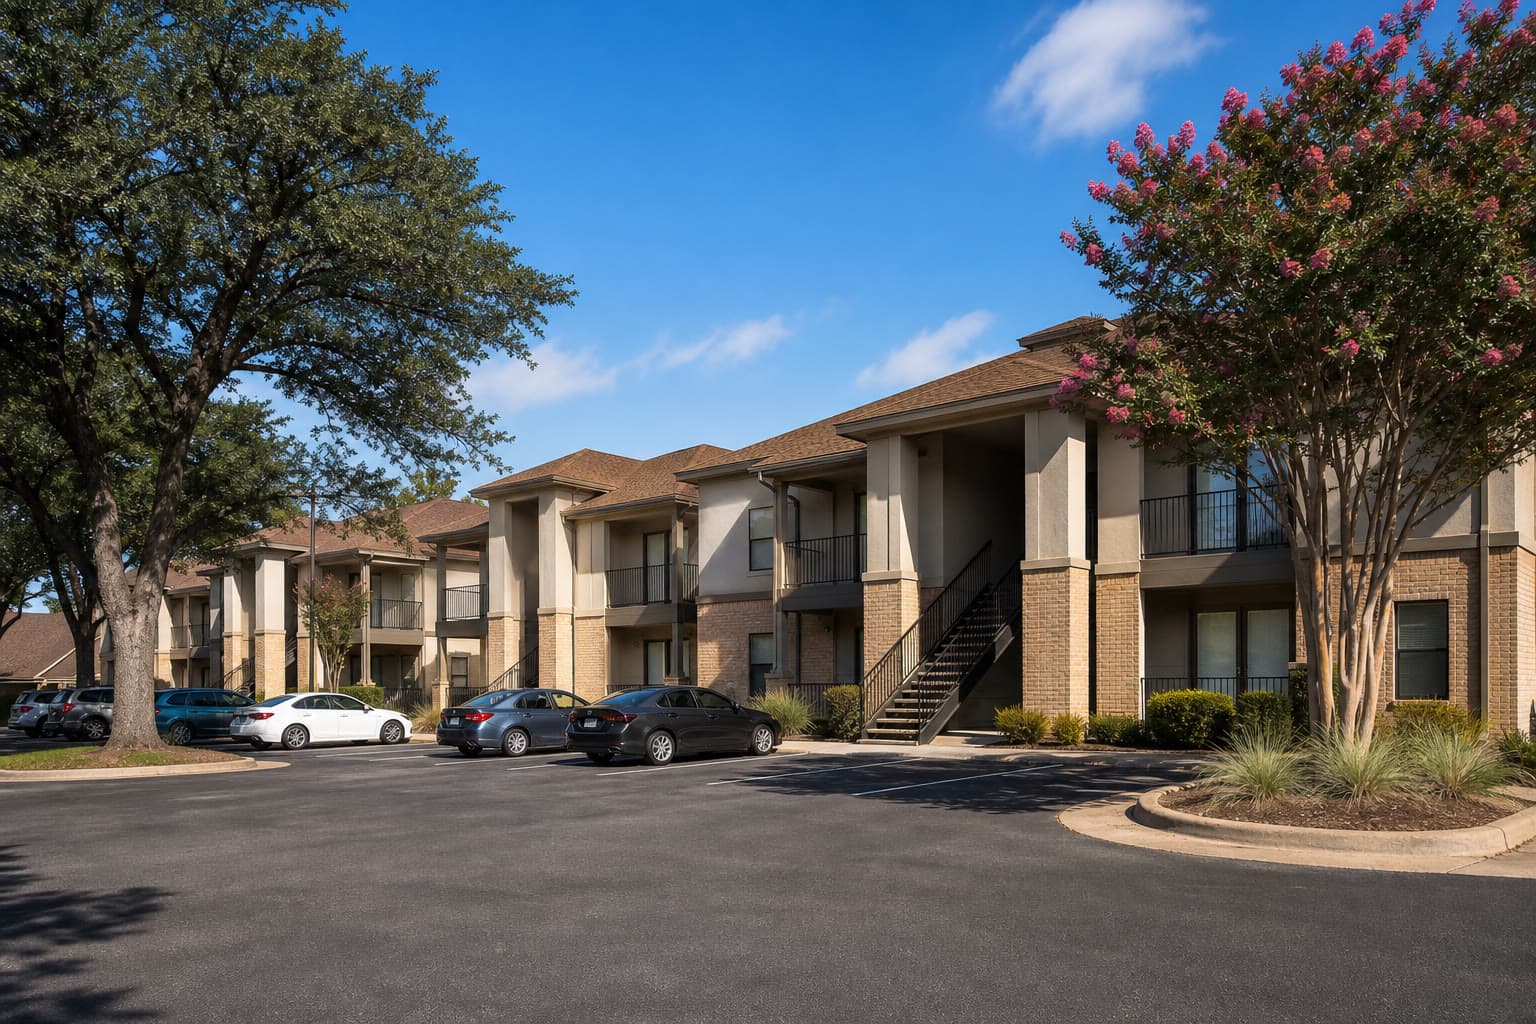
South-Central Multifamily Bridge Loans: Fixed Rates Around 6.75%
Soft-quote and term-sheet pricing on South-Central multifamily light and heavy bridge loans from April through July 2026.
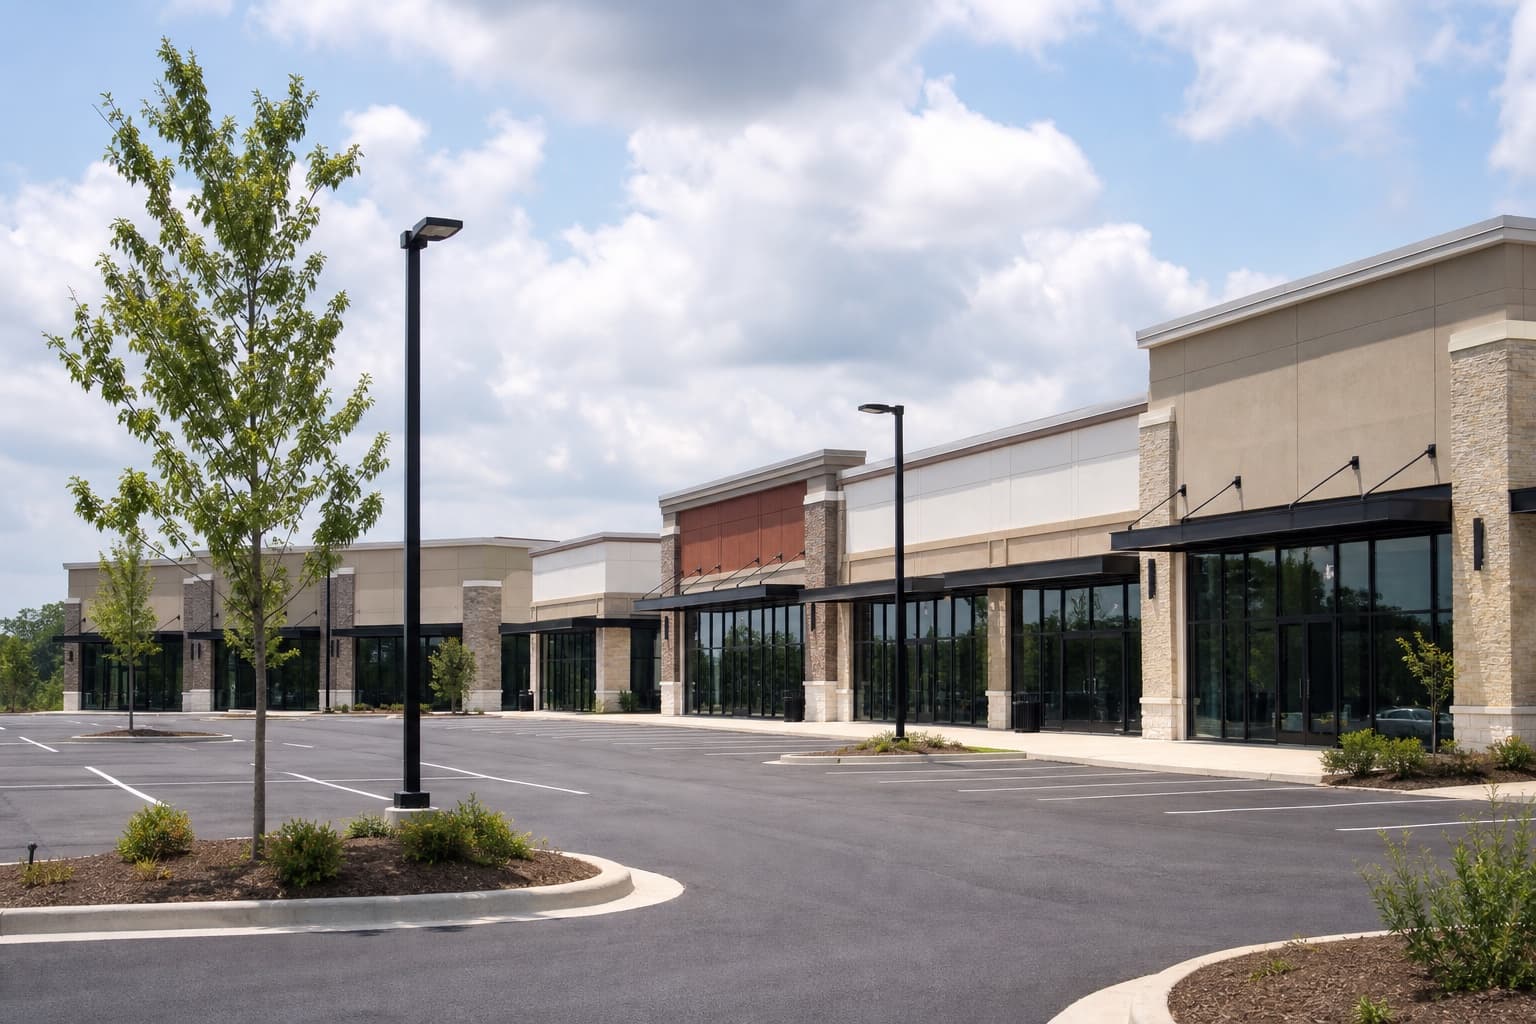
Unanchored Center Bridge Loans Nationally ($2M–$10M): Fixed Rates Near 6.51%
Based on soft-quote and term-sheet loan quotes on unanchored shopping centers, priced as bridge financing nationally from January through June 2026.