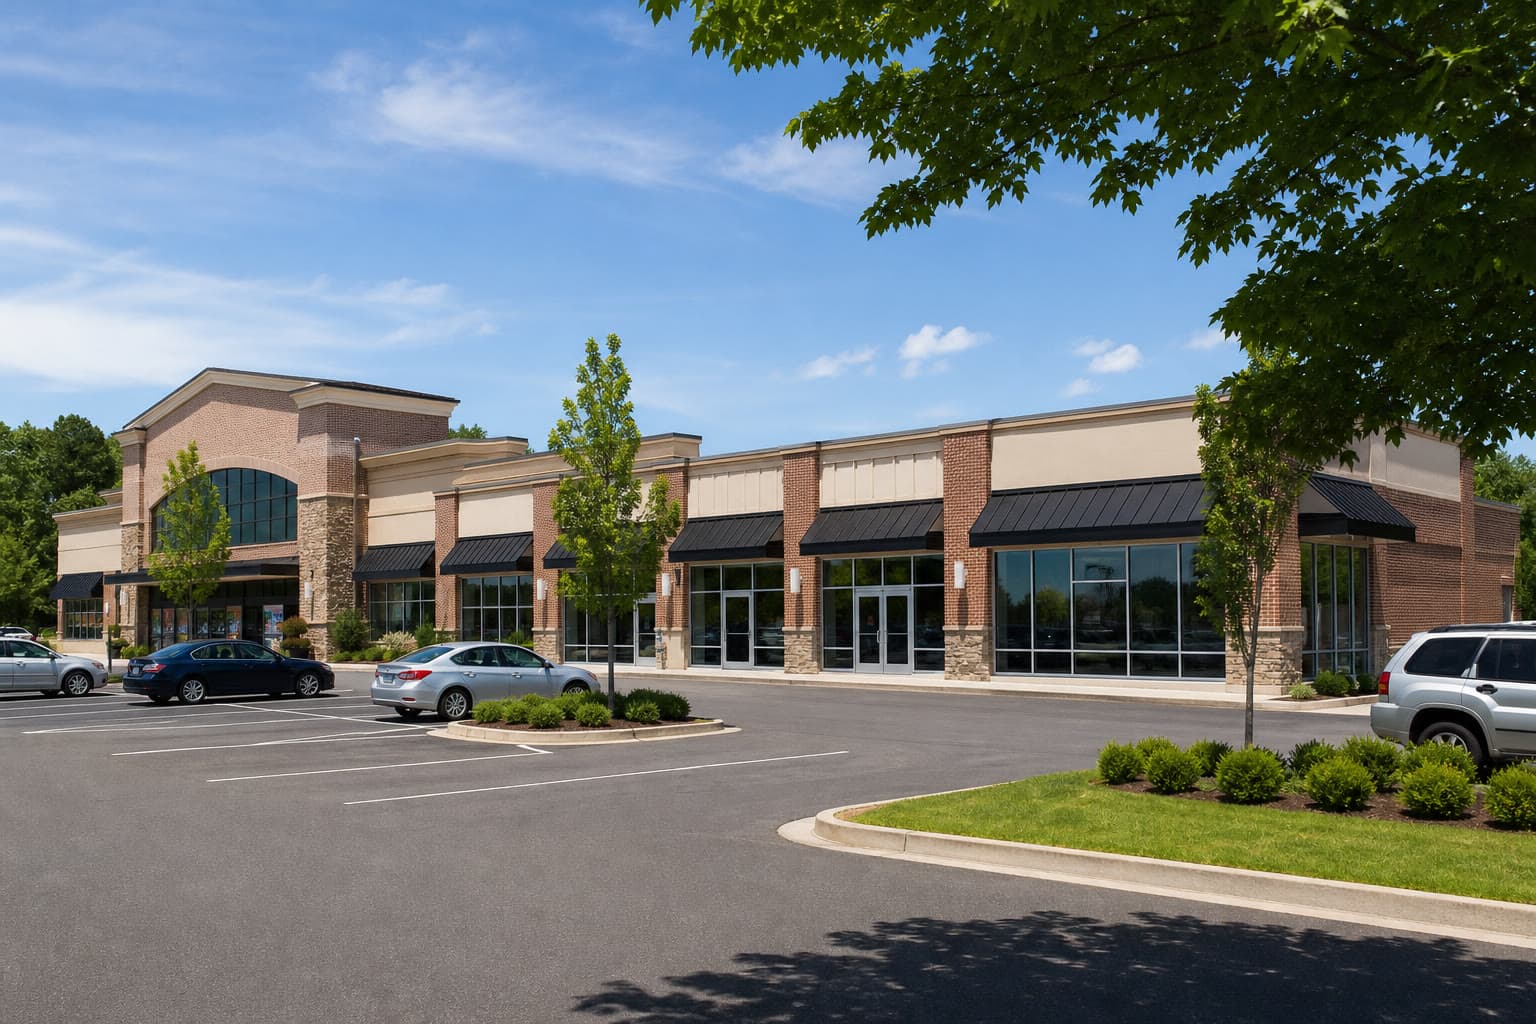
Soft-quote and term-sheet pricing on retail permanent loans in the Midwest and Northeast from May through August 2026.
On this page
Based on soft-quote and term-sheet loan quotes on retail properties in the Midwest and Northeast, priced as permanent financing, from May through August 2026. "Midwest and Northeast" here covers New York, Massachusetts, Michigan, Illinois, New Jersey, Ohio, Missouri, Indiana, and Pennsylvania. This pool spans single-tenant net lease (STNL) retail, urban/high street retail, unanchored and grocery-anchored centers, and a few other formats.
Fixed-rate quotes in this pool run from 6.125% to 8.50%, with a median of 6.75%. Floating-rate quotes, presented separately, are a thin sample — several tied to the same deal — ranging from 5.65% to 5.90%, with a median of 5.85%: directional only, not a stable floating benchmark. LTV has a median of 65% (45%–75%). DSCR requirements run from 1.10x to 1.80x, with a median of 1.25x. Of the quotes where recourse type was specified, the large majority carry full recourse, with a small share carrying partial or burn-off structures; separately, the large majority carry personal recourse guarantees, with a modest non-recourse share as well.
Geographically, this pool is concentrated in New York and Massachusetts, with smaller clusters in Michigan, Illinois, New Jersey, Ohio, and Missouri.
Amortization schedules most commonly run 25 years. An interest-only period appears on a minority of quotes, ranging from 12 to 60 months. Loan sizes in this pool range from $1,044,000 to $8,935,000, with a median loan amount of $3,055,000.
| Metric | Range | Median |
|---|---|---|
| Fixed rate | 6.125% – 8.50% | 6.75% |
| Floating rate | 5.65% – 5.90% (thin/concentrated sample) | 5.85% |
| LTV | 45% – 75% | 65% |
| DSCR | 1.10x – 1.80x | 1.25x |
| Recourse (of specified) | Mostly full, some partial/burn-off | — |
Fixed rate by asset type
| Asset type | Range | Median |
|---|---|---|
| STNL Retail | 6.12% – 8.05% | 6.75% |
| Urban/High Street Retail | 6.25% – 8.50% | 6.65% |
| STNL Retail – Investment Grade Tenant | 6.30% – 7.46% | 6.95% |
| Unanchored Center | 6.25% – 7.18% | 6.75% |
| Non-Grocery Anchored | 6.45% – 7.55% | 6.75% |
| Grocery-Anchored Shopping Center | 6.30% – 8.35% | 6.70% |
| Condo | 6.50% – 7.30% | 6.62% |
Investment-grade STNL tenants command a wider median than standard STNL (6.95% vs 6.75%) in this pool — the opposite of what the credit-tenant label might suggest, though this is worth watching rather than treating as settled.
Fixed rate by state
| State | Range | Median |
|---|---|---|
| New York | 6.12% – 8.35% | 6.62% |
| Massachusetts | 6.30% – 7.43% | 6.63% |
| Illinois | 6.35% – 8.50% | 6.65% |
| New Jersey | 6.25% – 7.18% | 6.53% |
| Michigan | 6.62% – 7.55% | 6.90% |
| Ohio | 6.55% – 7.75% | 6.88% |
| Missouri | 6.40% – 7.46% | 7.43% |
| Indiana | 6.50% – 7.30% | 6.76% |
New Jersey prices tightest at the median (6.53%), while the Midwest states in this pool (Michigan, Ohio, Missouri) all cluster noticeably wider (6.88%–7.43%) than the Northeast states shown here.
Fixed rate by loan size
| Loan Size | Range | Median |
|---|---|---|
| Under $2M | 6.25% – 8.05% | 6.75% |
| $2M – $5M | 6.25% – 8.50% | 6.75% |
| $5M+ | 6.125% – 8.35% | 6.625% |
Loan size barely moves the median here — all three bands land within about 13 bps of each other, with $5M+ deals pricing marginally tighter rather than wider.
Fixed rate distribution
| Band | Share of fixed-rate quotes |
|---|---|
| 6.00% – 6.50% | About a fifth |
| 6.50% – 7.00% | Nearly half |
| 7.00% – 7.50% | About a quarter |
| 7.50%+ | A small tail |
FAQ
What fixed rates is Lev seeing on retail permanent loans in the Midwest and Northeast right now?
Lev is seeing a median of 6.75%, with most quotes falling between 6.50% and 7.50%.
How does this compare across states?
New Jersey prices tightest at the median (6.53%), while Midwest states in this pool — Michigan, Ohio, and Missouri — run noticeably wider (6.88%–7.43%) than the Northeast states shown here.
Does retail format affect pricing?
Somewhat. STNL, unanchored centers, and non-grocery anchored all cluster near the pool median (6.70%–6.75%), while STNL with investment-grade tenants ran wider (6.95%) in this sample.
What about floating-rate quotes?
Lev saw very few floating-rate quotes in this region during the window, clustering tightly between 5.65% and 5.90% — too thin a sample to treat as a stable benchmark.
What LTV and DSCR is Lev seeing required?
Lev is seeing a median LTV of 65% and a median DSCR of 1.25x across this pool.
Another perspective.
All articles
Northeast Multifamily Bridge Loans: Fixed Rates Near 9.50%
Soft-quote and term-sheet pricing on Northeast multifamily bridge loans from April through August 2026.
Office Permanent Loans Nationally: Fixed Rates Near 6.50%
Soft-quote and term-sheet pricing on office permanent loans nationally from May through August 2026.
Hospitality Permanent Loans Nationally: Fixed Rates Near 6.75%
Soft-quote and term-sheet pricing on hospitality permanent loans nationally from May through August 2026.