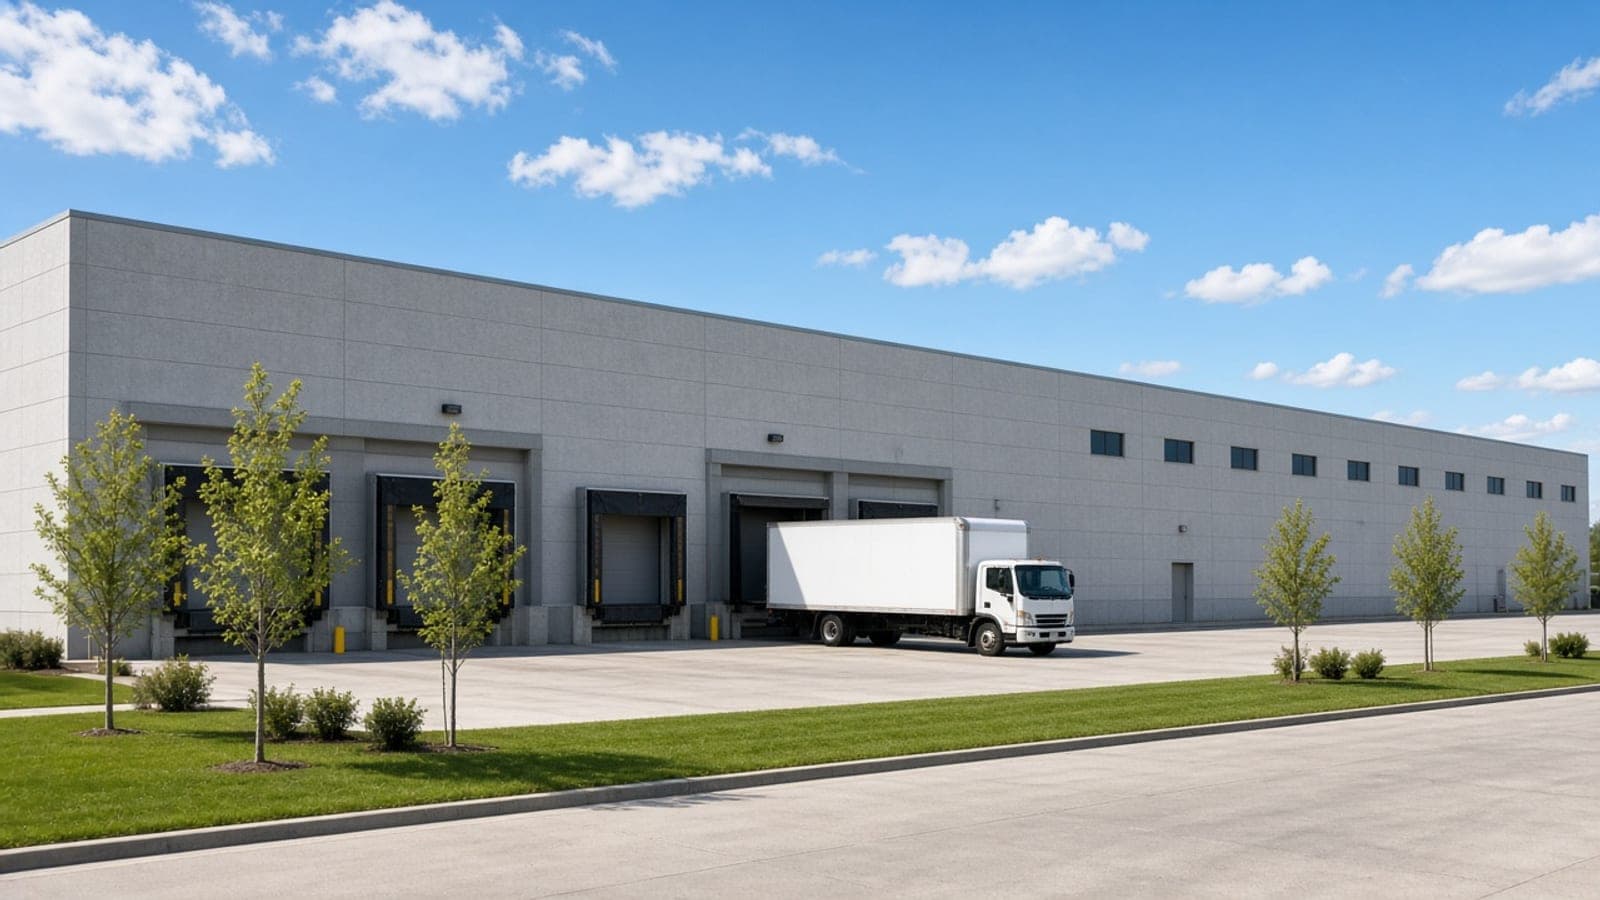
Soft-quote and term-sheet pricing on core industrial bridge loans nationally from April through September 2026.
On this page
Based on soft-quote and term-sheet loan quotes on core industrial properties nationally, priced as bridge financing (light and heavy bridge combined), from April through September 2026. This pool spans Warehouse/Distribution, Flex Industrial, and Industrial Outdoor Storage; Self Storage was excluded from this export and is covered separately as its own asset class.
Fixed-rate quotes in this pool run from 6.50% to 12.00%, with a median of 9.79%. Floating-rate quotes, presented separately, range from 5.90% to 10.15%, with a median of 7.40% — notably tighter and lower than fixed in this pool, which is somewhat unusual relative to other property types Lev has covered and worth reading as directional given the sample. LTV has a median of 65% (40%–80%). LTC — recorded on a smaller subset — has a median of 70% (58%–85%). DSCR is recorded on a smaller subset as well (1.20x–1.50x, median 1.30x). Of the quotes where recourse type was specified, the large majority carry full recourse, with a small share carrying burn-off or partial structures; separately, this pool splits fairly evenly between personal recourse and non-recourse guarantees — a notably higher non-recourse share than Lev typically sees on bridge financing.
Terms in this pool skew short, as expected for bridge financing — the largest clusters run 12 and 24 months, with a longer tail extending out to 36+ months on some heavier repositioning deals. An interest-only period is present on nearly every quote in this pool, ranging from 6 to 30 months; a stated amortization schedule appears on only a small minority of quotes and isn't meaningful to report as a pattern here. Loan sizes in this pool range from $1,000,000 to $10,000,000, with a median loan amount of $7,000,000 — notably larger than the typical multifamily bridge deal Lev has covered.
| Metric | Range | Median |
|---|---|---|
| Fixed rate | 6.50% – 12.00% | 9.79% |
| Floating rate | 5.90% – 10.15% | 7.40% |
| LTV | 40% – 80% | 65% |
| LTC | 58% – 85% | 70% |
| DSCR | 1.20x – 1.50x | 1.30x |
| Recourse (of specified) | Mostly full, some burn-off/partial | — |
Fixed rate by asset type
| Asset type | Range | Median |
|---|---|---|
| Warehouse / Distribution | 6.50% – 11.25% | 9.65% |
| Flex Industrial | 6.53% – 12.00% | 10.75% |
Floating rate by asset type
| Asset type | Range | Median |
|---|---|---|
| Warehouse / Distribution | 6.25% – 10.15% | 7.40% |
| Industrial Outdoor Storage | 7.16% – 7.66% | 7.66% |
| Flex Industrial | 5.90% – 9.15% | 6.16% |
Warehouse/Distribution anchors the bulk of this pool on both rate types and prices roughly in line with the overall median. Flex Industrial shows the widest split between its fixed and floating cohorts here — among the highest fixed pricing in the pool but the lowest floating pricing — which likely says more about which specific deals came through as fixed versus floating than about the format itself.
Fixed rate by state
| State | Range | Median |
|---|---|---|
| Florida | 6.50% – 11.25% | 9.79% |
| Michigan | 6.53% – 10.75% | 8.64% |
| New York | 10.00% – 10.00% | 10.00% |
| Texas | 12.00% – 12.00% | 12.00% |
Floating rate by state
| State | Range | Median |
|---|---|---|
| New Jersey | 6.55% – 7.75% | 7.16% |
| Florida | 6.25% – 8.30% | 7.40% |
| North Carolina | 6.40% – 8.00% | 7.81% |
| New York | 8.00% – 10.15% | 9.41% |
| Michigan | 5.90% – 6.16% | 6.03% |
Florida is the deepest market in this pool on both rate types, and New Jersey stands out as the largest floating-rate cluster, pricing near the middle of the pack. New York's fixed-rate quotes here are a very small sample and shouldn't be read as a stable state-level benchmark.
Fixed rate by loan size
| Loan Size | Range | Median |
|---|---|---|
| $3M – $7M | 6.50% – 10.75% | 9.63% |
| $7M+ | 6.68% – 11.25% | 9.79% |
Unlike some other property types, loan size doesn't meaningfully move fixed pricing here — the two bands land within about 15 bps of each other.
FAQ
What fixed rates is Lev seeing on core industrial bridge loans right now?
Lev is seeing a median of 9.79%, with a wide range from 6.50% to 12.00% depending on asset type, state, and deal specifics.
What about floating-rate quotes?
Lev is seeing floating-rate quotes range from 5.90% to 10.15%, with a median of 7.40% — tighter than fixed in this pool, which runs counter to the usual pattern and is worth treating as directional given the sample.
Does the industrial subtype affect pricing?
Somewhat. Warehouse/Distribution anchors the bulk of the pool near the overall median; Flex Industrial shows the widest spread between its fixed and floating cohorts.
Where is core industrial bridge activity concentrated?
Florida is the deepest market in this pool on both rate types, with New Jersey standing out as the largest floating-rate cluster.
What LTV and LTC is Lev seeing required?
Lev is seeing a median LTV of 65% and a median LTC of 70% across this pool.
How recourse-heavy is core industrial bridge financing?
This pool splits fairly evenly between personal recourse and non-recourse guarantees — a notably higher non-recourse share than Lev typically sees on bridge financing.
Another perspective.
All articles
Unanchored Center Bridge Loans Nationally ($2M–$10M): Fixed Rates Near 6.51%
Based on soft-quote and term-sheet loan quotes on unanchored shopping centers, priced as bridge financing nationally from January through June 2026.
Northeast Multifamily Bridge Loans: Fixed Rates Near 9.50%
Soft-quote and term-sheet pricing on Northeast multifamily bridge loans from April through August 2026.
Office Permanent Loans Nationally: Fixed Rates Near 6.50%
Soft-quote and term-sheet pricing on office permanent loans nationally from May through August 2026.