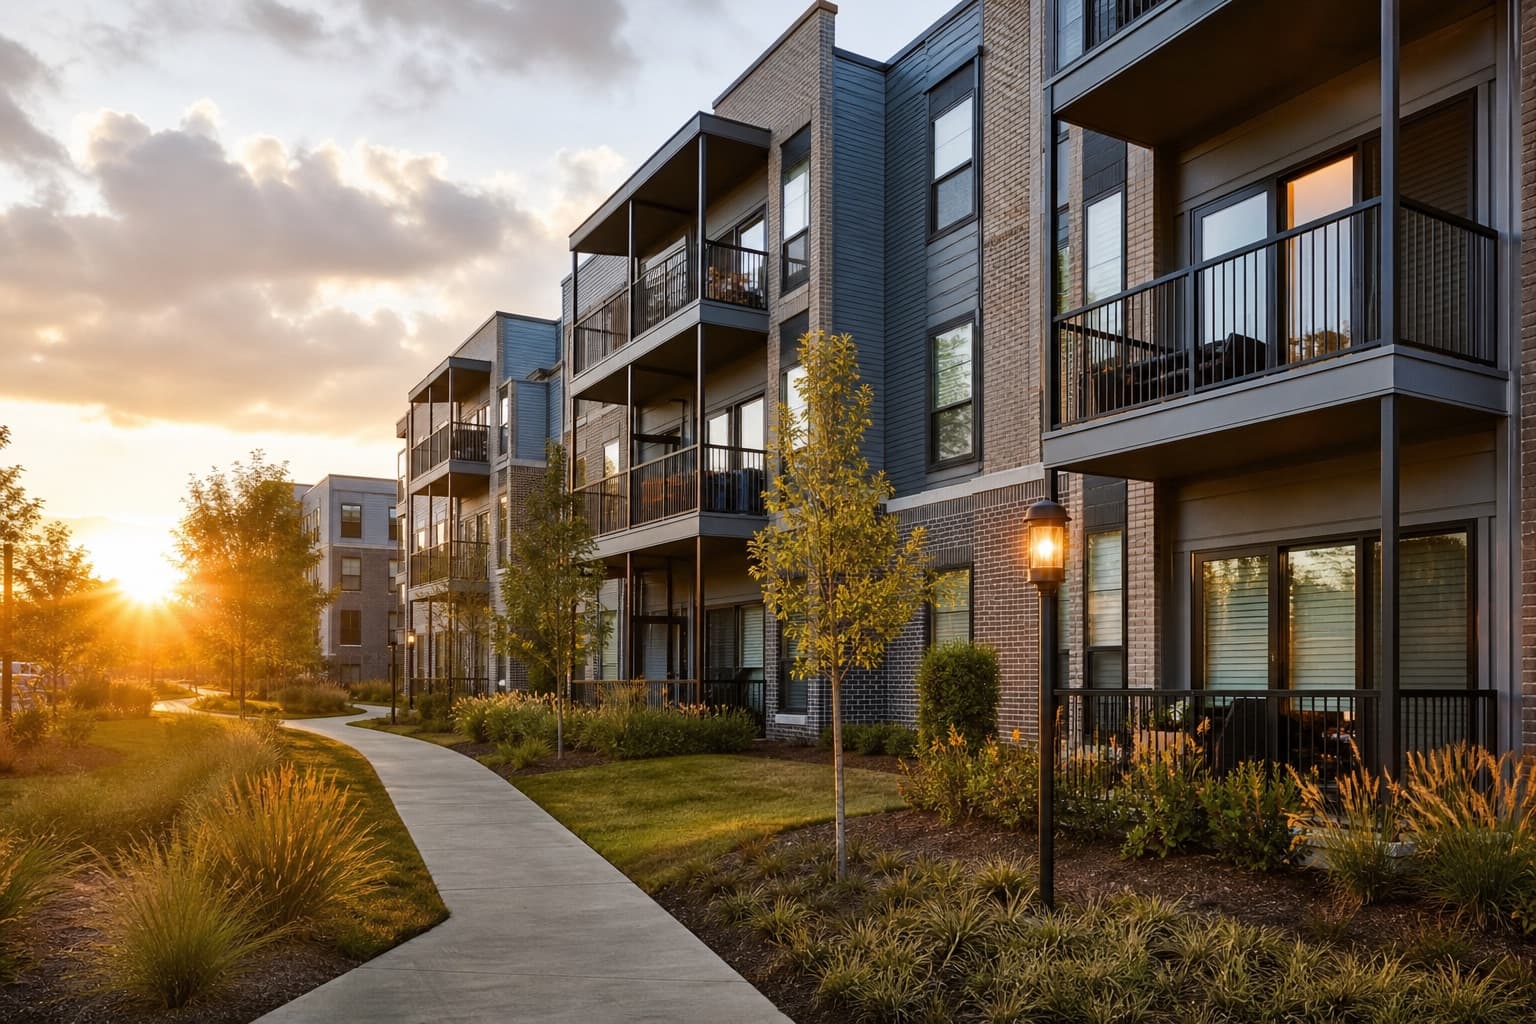
Multifamily cap rates held near 5.7% for seven quarters — and Q1 2026 data shows the first signs of gradual compression. Here's where pricing stands by class and market.
On this page
Cap rate compression is the multifamily story everyone's watching for in 2026 — and the data says it's finally, gradually, starting to happen.
National multifamily cap rates held at 5.7% for seven straight quarters — the longest stretch of unchanged pricing in 25 years. As of Q1 2026, the blended average across classes eased slightly to 5.6–5.8%, depending on the data source.
Cap rates by class
| Class / Market Tier | Typical Cap Rate Range |
|---|---|
| Class A, primary markets | 4.5% – 5.5% |
| Class B, secondary markets | 5.5% – 7.0% |
| Class C, tertiary markets | 7.0% – 9.0%+ |
Geography matters as much as class: New York City trades around 5.4%, reflecting a supply-constrained, high-barrier market, while Midwest metros have compressed roughly 40 basis points since Q4 2025 to also sit near 5.8%.
Why cap rates may keep falling
First American's Potential Cap Rate model puts the "true" fundamentals-supported rate at 5.1% — a 60-basis-point gap versus where deals are actually pricing. That gap suggests current cap rates are running higher than justified, and it's closing as three forces play out at once: strong renter household formation (up ~2.7% year over year), easing credit, and continued distress resolution across overleveraged 2021–2022 vintage deals.
The financing backdrop
The Federal Housing Finance Agency raised 2026 Fannie Mae and Freddie Mac loan purchase caps to $88 billion each — $176 billion combined, a 20% increase over 2025 — expanding the pool of available agency debt. Agency multifamily rates start as low as 5.1%, but the average CRE loan rate across all lender types still sits near 6.2%, versus roughly 4.8% on the debt now coming due. That refinancing cost gap is the real headwind, even as cap rates ease.
How Lev helps
Lev connects multifamily sponsors to agency, bank, and debt fund lenders sized to today's rate environment — and helps model the refinancing cost gap before it becomes a cash-flow problem.
Data: CBRE, Arbor Realty Trust, First American, JPMorgan, FHFA. As of Q1–Q2 2026.
Another perspective.
All articles
5 Types of Commercial Real Estate Loans, Compared
Not all commercial real estate debt works the same way. Here's how the five most common CRE loan types compare on rate, leverage, and use case, based on current market pricing.

What Is DSCR? How Lenders Calculate Debt Service Coverage in 2026
Debt service coverage ratio (DSCR) is the single number most commercial real estate lenders lean on to answer one question: can this property pay for its own debt? Here's how it's calculated, what lenders expect in 2026, and why it matters more than your credit score on most commercial deals.
What Is a Bridge Loan? A Plain-English Guide for 2026
Commercial bridge loans are short-term, interest-only financing — typically 12 to 36 months — used when a deal isn't ready for permanent debt. Here's how they price and underwrite in 2026.